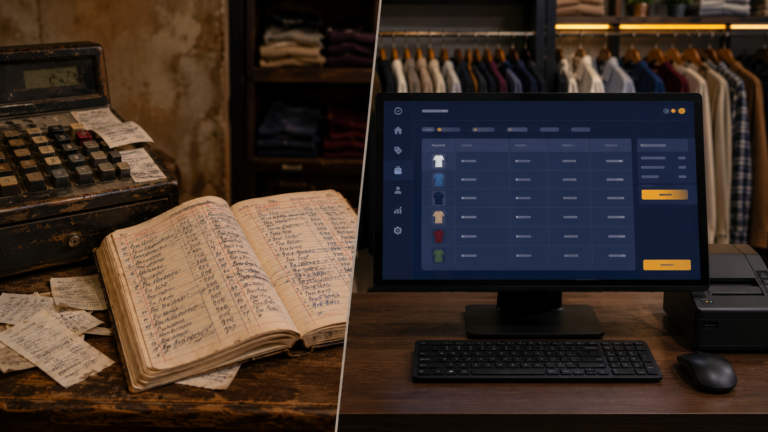

A database helps nobody until you make it readable. After weeks of billing, cloth_store.db was filling with sales the shop had never captured before, but rows in tables answer no questions on their own. The whole promise of this project was one screen the owner could open and see the truth: what is in stock, what sold, and what the shop actually earned. This post is about building that report, and the schema decision that made honest profit possible.
Everything rests on how sales are recorded. One sale is not one row, it is a header plus lines, because a customer buys several items on one invoice. So sales live in two tables, tied together by keys:
self.cursor.execute('''
    CREATE TABLE IF NOT EXISTS sales (
        id INTEGER PRIMARY KEY AUTOINCREMENT,
        invoice_number TEXT UNIQUE,
        customer_name TEXT,
        sale_date TEXT,
        subtotal REAL,
        discount_amount REAL,
        total_amount REAL
    )
''')
self.cursor.execute('''
    CREATE TABLE IF NOT EXISTS sale_items (
        id INTEGER PRIMARY KEY AUTOINCREMENT,
        sale_id INTEGER,
        product_id INTEGER,
        quantity INTEGER,
        unit_price REAL,
        total_price REAL,
        FOREIGN KEY (sale_id) REFERENCES sales (id),
        FOREIGN KEY (product_id) REFERENCES products (id)
    )
''')
The sales row is the invoice, who, when, totals. Each sale_items row is one line on it, which product, how many, at what price, pointing back to its invoice through sale_id and to the product through product_id. Those FOREIGN KEY links are what let a query walk from a sold line to the product it came from, and the product carries the one number paper never has, cost_price.
That walk is the profit report. Join the sold lines to their products, and margin falls out per line, revenue minus cost times quantity:
self.cursor.execute('''
    SELECT p.name,
           SUM(si.quantity)                                   AS units_sold,
           SUM(si.total_price)                                AS revenue,
           SUM((si.unit_price - p.cost_price) * si.quantity)  AS profit
    FROM sale_items si
    JOIN products p ON p.id = si.product_id
    JOIN sales s    ON s.id = si.sale_id
    WHERE s.sale_date BETWEEN ? AND ?
    GROUP BY p.id
    ORDER BY profit DESC
''', (start_date, end_date))
Read what that returns: every product, its units sold, its revenue, and its actual profit for the chosen dates, sorted so the biggest earners top the list. GROUP BY collapses the lines into one row per product, SUM does the arithmetic across every sale in the range. The stock side of the report is simpler, the products table already holds live quantities because every completed sale decrements them, so low stock is one WHERE clause away. All of it renders into a ttk.Treeview table on the Sales Report tab, dated, sortable, readable at a glance.
The first time the profit column filled with real numbers was the moment this stopped being a coding exercise. Bestsellers by revenue were not the bestsellers by profit. Paper could never have shown that.
A few things people ask me about this
Why split sales into two tables? Because an invoice has many lines. The sales table is the invoice header, sale_items holds each product line pointing back with sale_id. One table forces you to duplicate invoice data on every line or lose the line detail entirely.
How do I calculate profit in SQL? Join sold lines to products and compute SUM((si.unit_price - p.cost_price) * si.quantity) grouped by product. It requires cost_price stored on the product, which is why capturing cost from day one matters.
Next
The report told the owner the truth. The receipt, though, was still fighting me, my professional-sounding PDF receipts turned out to be exactly the wrong thing for a busy counter. Why I ripped that library out is the next post.